10 templates
Project Management Excel Templates
Gantt charts, risk registers, RACI, capacity and burndown — without buying project software.
Plenty of projects are too small to justify project software and too big to run from a list. These templates cover the parts that actually get asked for: a plan on one page, who is accountable, what could go wrong, and whether the team has the capacity.
They are built to be shown to somebody else. Each one prints on a single page wide, so a status meeting does not begin with somebody scrolling sideways.
- Templates
- 10
- Free
- 1
- Live formulas
- 355
- Bundle
- $39
All 9 Projects templates — $39
Bought one at a time that is $114. One payment, instant download, yours to keep and use commercially.
Every projects template
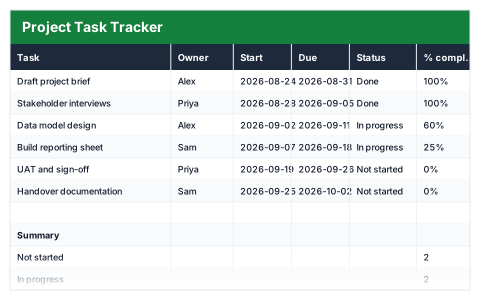
Tasks with owners and dates, plus a live count of what is done and overdue.
For: Anyone running a project without project software
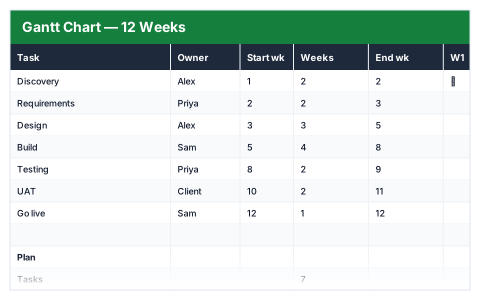
12-week bars that draw themselves from a start week and a duration.
For: A project manager reporting upwards
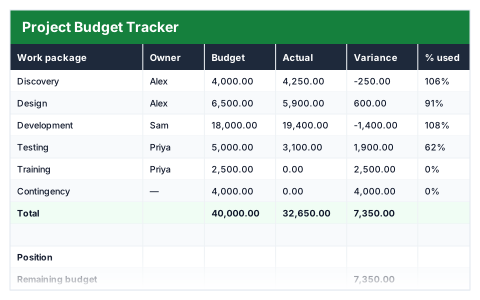
Variance per work package with an over-budget flag that colours itself.
For: A PM answerable for project spend
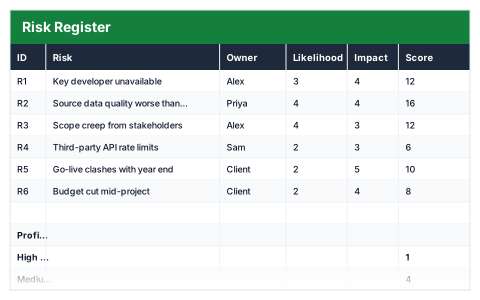
Likelihood × impact scoring with a rating band that sets itself.
For: A PM on a formal or governed project
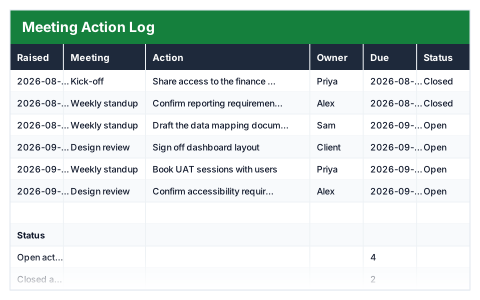
One row per action, with overdue flagged against today automatically.
For: Whoever runs the weekly meeting
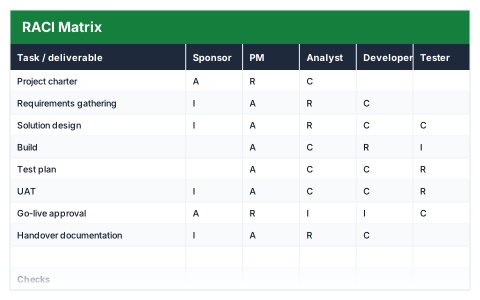
Who is Responsible, Accountable, Consulted and Informed — with a check that every task has exactly one A.
For: A PM untangling who decides what
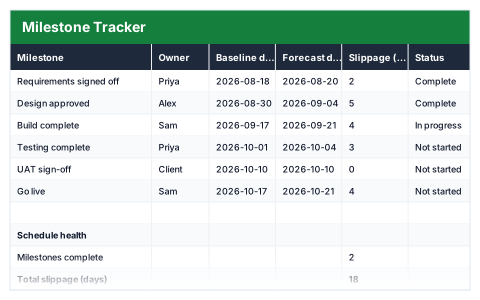
Baseline against forecast, showing slippage in days per milestone.
For: A PM reporting progress to a sponsor
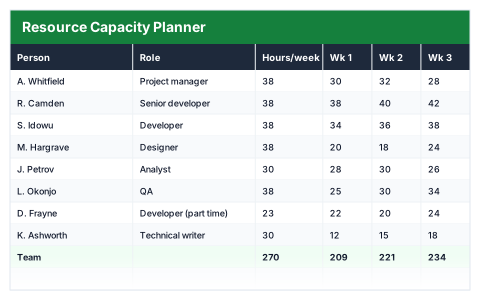
Hours booked against each person week by week, with anyone over their capacity flagged before it hurts.
For: A team lead juggling people across work
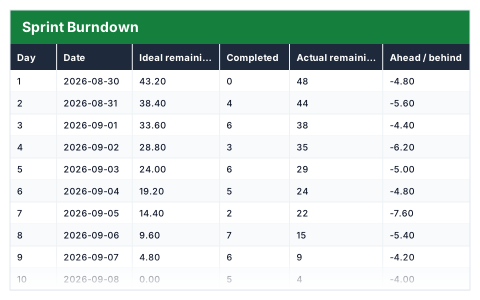
Ideal against actual points remaining each day, with the velocity you would need to finish on time.
For: A scrum master or dev lead
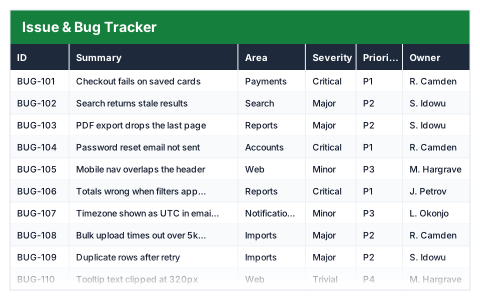
Issues scored by severity and priority, aged against today, with the open queue counted for you.
For: A dev lead or QA triaging defects
Questions about projects templates
Is the Gantt chart a real chart or a picture?
It is built from formulas and conditional formatting, so bars move when you change the dates. Nothing is drawn by hand.
Can I use these alongside Jira or Asana?
Yes. Many teams run delivery in a tool and still report upward on a page like these, because a sponsor wants dates rather than a backlog.
How many tasks can they hold?
Each file ships with a block of sample rows and the formulas cover the whole block. Insert rows inside it rather than below and the totals keep up.