Projects template
Gantt Chart
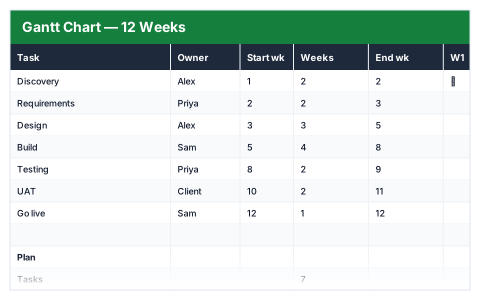
12-week bars that draw themselves from a start week and a duration.
- Live formulas
- 96
- Columns
- 17
- File
- 8 KB
$5
Checkout opening soonOr get it with all 66 paid templates in the complete pack — $45.
Works in Excel 2013 and later, Microsoft 365, Google Sheets and LibreOffice Calc. Set up to print landscape on one page wide.
About this Gantt Chart template
A Gantt chart shows who is doing what and when across the life of a project. This Excel Gantt chart template draws a bar for each task across 12 weeks from just two numbers: the start week and how many weeks the task takes.
Change either number and the bar redraws itself — no dragging shapes around. The plan summary shows the number of tasks, total effort in task-weeks and how long the project runs.
Good for
- →Planning a project of up to 12 weeks
- →Showing a client or manager the timeline at a glance
- →Spotting where tasks overlap and people are stretched
What it works out for you
Plan
- →Tasks
- →Total effort (task-weeks)
- →First week
- →Last week
- →Project length (weeks)
What you fill in
The table has 17 columns. Calculated columns fill themselves in; the rest are yours to type over.
- →Task
- →Owner
- →Start wk
- →Weeks
- →End wk
- →W1
- →W2
- →W3
- →W4
- →W5
- →W6
- →W7
- →W8
- →W9
- →W10
- →W11
- →W12
How to use it
Set a start week and a duration; the bar fills itself. Change either and the chart redraws — no dragging shapes around.
The file opens with sample rows so you can see every formula working before you change anything. Type your own figures over them. When you need more rows, insert them inside the existing block rather than underneath it, so the totals keep covering every row.
Functions it uses
Every one of these exists in Excel, Google Sheets and LibreOffice, so the file behaves the same wherever you open it.
ANDCOUNTAIFMAXMINSUMQuestions about the Gantt Chart
How are the bars drawn?
Each week cell checks whether that week falls between the task's start and end week, and the bar is shaded wherever it does.
Can I plan more than 12 weeks?
The template is set up for 12 weeks. You can add weeks by copying the last week column, with its formula and formatting, across.
Does it show dependencies between tasks?
No. It shows timing only. Set start weeks so a dependent task begins after the one it relies on.