9 templates
Data Analysis Excel Templates
KPI dashboards, statistics, A/B tests, surveys and forecasting.
These are the templates for turning numbers into something you can say out loud. A KPI dashboard that judges each measure the right way round, a significance calculator that tells you whether a result is real, a forecast built from history rather than optimism.
The statistics are done properly. The A/B test calculator reports significance rather than simply declaring a winner, and the descriptive statistics summary covers the measures that get asked for in a review.
- Templates
- 9
- Free
- 0
- Live formulas
- 333
- Bundle
- $39
All 9 Data templates — $39
Bought one at a time that is $119. One payment, instant download, yours to keep and use commercially.
Every data template
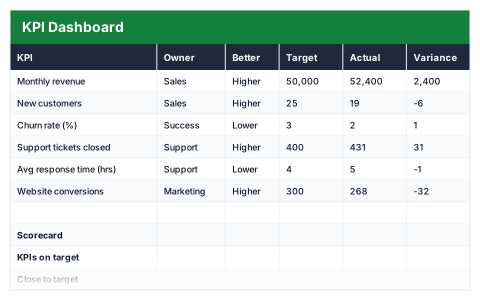
Target against actual with on/off-target status, direction-aware so lower can be better.
For: A manager reporting monthly numbers
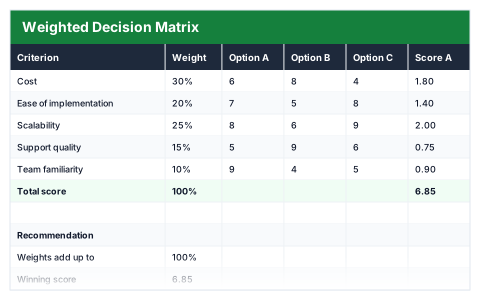
Scores options against weighted criteria so the choice is calculated, not argued.
For: Anyone choosing between options on more than price
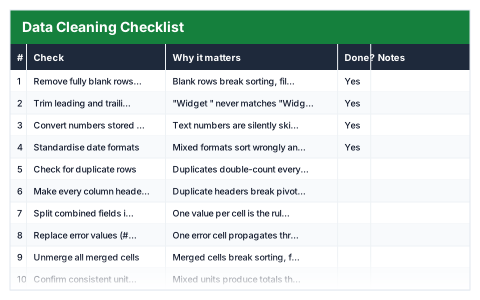
Twelve checks to run before any analysis, with progress tracked as you work.
For: An analyst inheriting somebody else’s data
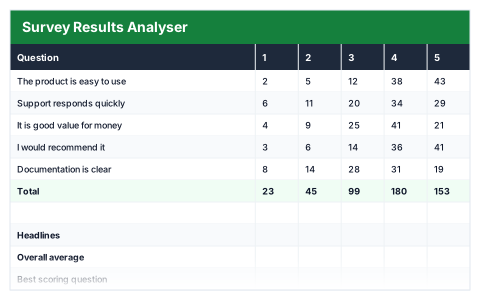
Turns 1–5 responses into averages, top-box scores and a distribution per question.
For: Whoever ran the survey
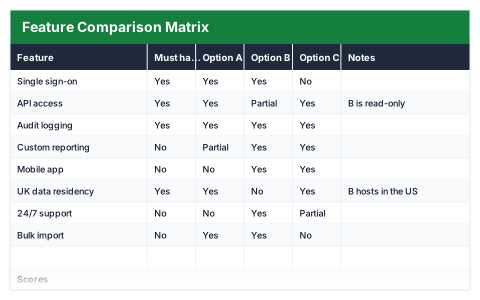
Compare vendors or products feature by feature, with a must-have check that fails loudly.
For: A buyer evaluating software or suppliers
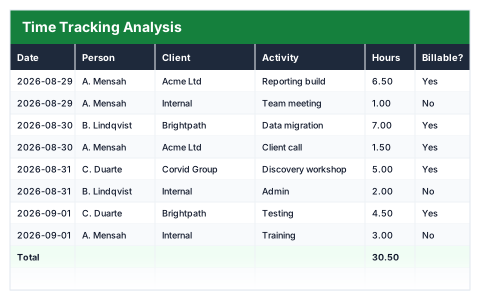
Where the hours actually went, split billable against non-billable by client and activity.
For: A consultant or agency reviewing where hours went
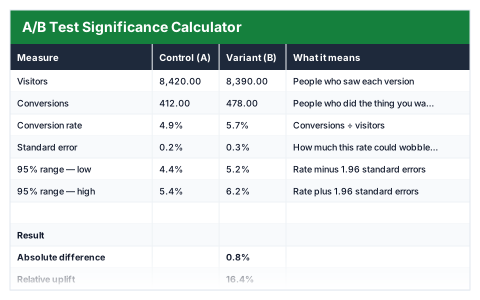
Whether a conversion difference is real or noise — z-score, p-value and a plain verdict.
For: A marketer checking a result is real
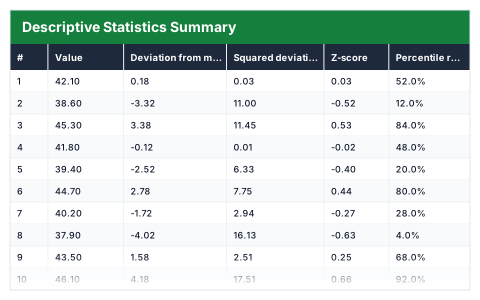
Mean, median, quartiles, spread and z-scores for a column of numbers, with outliers flagged.
For: A student, researcher or analyst
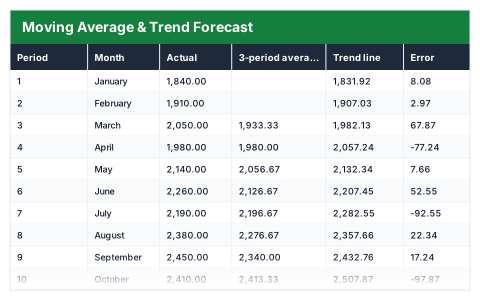
A three-month moving average, a fitted trend line and the next three periods, with the error measured.
For: Anyone forecasting from past figures
Questions about data templates
Do I need the Analysis ToolPak?
No. Everything uses standard functions that exist in Excel, Google Sheets and LibreOffice, so nothing extra has to be installed or enabled.
Is the A/B test calculator statistically sound?
It reports significance from the sample sizes and conversion counts you enter rather than calling a winner on a difference alone, which is the usual mistake with small samples.
Can the dashboard handle my own measures?
Yes. Each KPI is set to higher-is-better or lower-is-better, so response times and churn are judged correctly rather than being treated like revenue.