Projects template
Project Task Tracker
Tasks with owners and dates, plus a live count of what is done and overdue.
- Live formulas
- 11
- Columns
- 7
- File
- 8 KB
Free
Download .xlsxNo signup, no email. Yours to edit and use commercially.
Works in Excel 2013 and later, Microsoft 365, Google Sheets and LibreOffice Calc. Set up to print on one page wide.
About this Project Task Tracker template
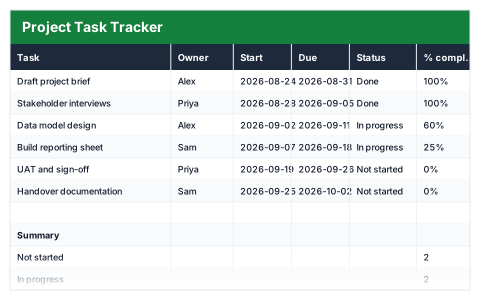
A project task list is only useful if it shows what is running late. This free Excel project task tracker lists every task with its owner, start and due dates, status and percentage complete, and counts the days left against today's date.
The summary counts tasks not started, in progress, done and overdue, and shows the average completion across the project.
Good for
- →Small teams running a project without dedicated software
- →A personal to-do list with deadlines
- →A quick status update for a weekly meeting
What it works out for you
Summary
- →Not started
- →In progress
- →Done
- →Overdue
- →Average completion
What you fill in
The table has 7 columns. Calculated columns fill themselves in; the rest are yours to type over.
- →Task
- →Owner
- →Start
- →Due
- →Status
- →% complete
- →Days left
How to use it
Days left counts from today, so it is never stale. Use the Status dropdown — the summary counts depend on the exact wording.
The file opens with sample rows so you can see every formula working before you change anything. Type your own figures over them. When you need more rows, insert them inside the existing block rather than underneath it, so the totals keep covering every row.
Functions it uses
Every one of these exists in Excel, Google Sheets and LibreOffice, so the file behaves the same wherever you open it.
AVERAGECOUNTIFCOUNTIFSIFTODAYQuestions about the Project Task Tracker
How does it spot overdue tasks?
It checks each task's due date against today's date together with its status, so a task past its due date that is not done is counted as overdue.
Why does the Status dropdown matter?
The summary counts use the exact status wording. Picking from the dropdown keeps those counts accurate.
Does it draw a timeline?
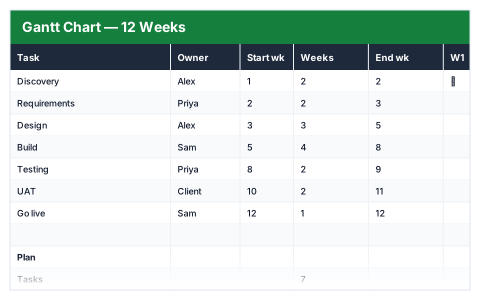
No. For bars across weeks, the Gantt Chart template draws itself from a start week and a duration.