Data template
Moving Average & Trend Forecast
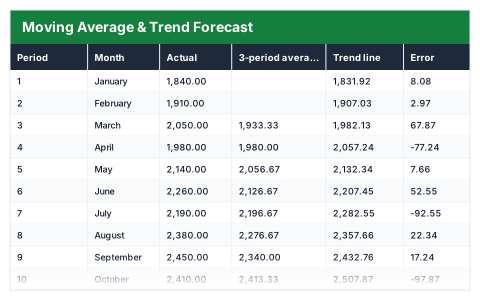
A three-month moving average, a fitted trend line and the next three periods, with the error measured.
- Live formulas
- 74
- Columns
- 8
- File
- 9 KB
$5
Checkout opening soonOr get it with all 66 paid templates in the complete pack — $45.
Works in Excel 2013 and later, Microsoft 365, Google Sheets and LibreOffice Calc. Set up to print landscape on one page wide.
About this Moving Average & Trend Forecast template
A simple, transparent forecast is often more useful than a complicated one nobody trusts. This Excel template takes a history of monthly figures, calculates a three-period moving average and a least-squares trend line, then extends the trend to forecast the next three periods.
It measures the error for every period and shows the fit quality (R²) and the mean absolute percentage error, so you can see how far to trust the forecast.
Good for
- →Forecasting next quarter's sales or demand
- →Smoothing noisy monthly figures to see the trend
- →Planning stock or staffing from past volumes
What it works out for you
The trend, and what comes next
- →Periods of history
- →Average
- →Trend per period
- →Trend at period zero
- →Fit quality (R²)
- →Average absolute % error (MAPE)
- →Forecast for period 13
- →Forecast for period 14
- →Forecast for period 15
- →Next three periods combined
- →Growth over the history
- →Average change per period
- →Best period
- →Worst period
- →Direction
What you fill in
The table has 8 columns. Calculated columns fill themselves in; the rest are yours to type over.
- →Period
- →Month
- →Actual
- →3-period average
- →Trend line
- →Error
- →Absolute % error
- →Change on last period
How to use it
Replace the Actual column with your own figures. The trend line is a least-squares fit; the forecast extends it, and MAPE tells you how much to trust it.
The file opens with sample rows so you can see every formula working before you change anything. Type your own figures over them. When you need more rows, insert them inside the existing block rather than underneath it, so the totals keep covering every row.
Functions it uses
Every one of these exists in Excel, Google Sheets and LibreOffice, so the file behaves the same wherever you open it.
ABSAVERAGECOUNTIFIFERRORMAXMINRSQSLOPEQuestions about the Moving Average & Trend Forecast
What is a moving average?
The average of the latest three periods, recalculated each month. It smooths out short-term ups and downs so the direction is easier to see.
What does MAPE tell me?
The mean absolute percentage error: on average, how far the trend line sat from the actual figures, as a percentage. Lower is better.
Does it handle seasonality?
No. It fits a straight-line trend, so for strongly seasonal data treat the forecast as a baseline rather than a prediction.