Data template
Descriptive Statistics Summary
Mean, median, quartiles, spread and z-scores for a column of numbers, with outliers flagged.
- Live formulas
- 144
- Columns
- 7
- File
- 9 KB
$5
Checkout opening soonOr get it with all 66 paid templates in the complete pack — $45.
Works in Excel 2013 and later, Microsoft 365, Google Sheets and LibreOffice Calc. Set up to print on one page wide.
About this Descriptive Statistics Summary template
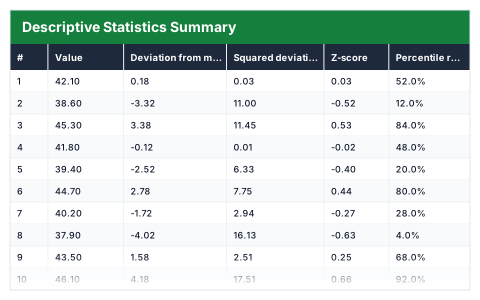
Before analysing a set of numbers, you need to know what they look like. This Excel descriptive statistics template takes a column of values and works out the count, mean, median, range, quartiles, interquartile range, standard deviation, variance and a 95% confidence interval for the mean.
Every value gets its deviation from the mean, a z-score and a percentile rank, and anything more than two standard deviations from the mean is flagged as an outlier.
Good for
- →Summarising survey, sales or performance data
- →Checking a dataset for outliers before analysis
- →Learning descriptive statistics with every formula visible
What it works out for you
Centre and spread
- →Count
- →Sum
- →Mean
- →Median
- →Minimum
- →Maximum
- →Range
- →Lower quartile (Q1)
- →Upper quartile (Q3)
- →Interquartile range
- →Standard deviation (sample)
- →Variance (sample)
- →Coefficient of variation
- →Standard error of the mean
- →95% confidence — low
- →95% confidence — high
- →Values beyond 2 standard deviations
- →Tukey lower fence
- →Tukey upper fence
What you fill in
The table has 7 columns. Calculated columns fill themselves in; the rest are yours to type over.
- →#
- →Value
- →Deviation from mean
- →Squared deviation
- →Z-score
- →Percentile rank
- →Flag
How to use it
Paste your numbers into the Value column, over the samples. Everything else — deviations, z-scores, outlier flags and the whole summary — recalculates.
The file opens with sample rows so you can see every formula working before you change anything. Type your own figures over them. When you need more rows, insert them inside the existing block rather than underneath it, so the totals keep covering every row.
Functions it uses
Every one of these exists in Excel, Google Sheets and LibreOffice, so the file behaves the same wherever you open it.
ABSAVERAGECOUNTCOUNTIFIFIFERRORMAXMEDIANMINQUARTILESQRTSTDEVSUMVARQuestions about the Descriptive Statistics Summary
Is the standard deviation for a sample or a population?
A sample. It uses STDEV, which divides by n − 1 — the right choice when your data is a sample of a larger group.
How are outliers flagged?
Values with a z-score beyond ±2 are flagged as outliers and those beyond ±1.5 as unusual. The Tukey fences, based on the interquartile range, are shown as well.
Can I use more than 25 values?
Yes. Insert rows inside the value block and every formula and the summary include them.