Data template
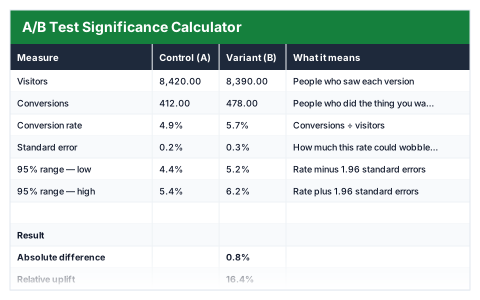
A/B Test Significance Calculator
Whether a conversion difference is real or noise — z-score, p-value and a plain verdict.
- Live formulas
- 19
- Columns
- 4
- File
- 8 KB
$5
Checkout opening soonOr get it with all 66 paid templates in the complete pack — $45.
Works in Excel 2013 and later, Microsoft 365, Google Sheets and LibreOffice Calc. Set up to print on one page wide.
About this A/B Test Significance Calculator template
A higher conversion rate in a test does not always mean the change worked; it could be chance. This Excel A/B test significance calculator takes visitors and conversions for the control and the variant and runs a standard two-proportion z-test, one visible step at a time.
It shows each conversion rate with its 95% range, the absolute and relative uplift, the z-score, the two-tailed p-value and a plain-English verdict, plus a check that there are enough conversions to trust the result.
Good for
- →Checking landing page and email tests
- →Deciding whether to roll out a winning variant
- →Explaining a test result to people who are not statisticians
What it works out for you
Result
- →Absolute difference
- →Relative uplift
- →Pooled conversion rate
- →Standard error of the difference
- →Z-score
- →P-value (two-tailed)
- →Confidence
- →Significant at 95%?
- →Verdict
- →Sample check
- →Extra visitors needed for a clean read
What you fill in
The table has 4 columns. Calculated columns fill themselves in; the rest are yours to type over.
- →Measure
- →Control (A)
- →Variant (B)
- →What it means
How to use it
Enter visitors and conversions for each variant. Everything below is a standard two-proportion z-test, written out step by step so you can check the working.
The file opens with sample rows so you can see every formula working before you change anything. Type your own figures over them. When you need more rows, insert them inside the existing block rather than underneath it, so the totals keep covering every row.
Functions it uses
Every one of these exists in Excel, Google Sheets and LibreOffice, so the file behaves the same wherever you open it.
ABSIFIFERRORMINNORM.S.DISTSQRTQuestions about the A/B Test Significance Calculator
What does the p-value mean?
Roughly, how likely a difference at least this large would be if the two versions really performed the same. Below 0.05 is the usual threshold for calling a result significant at 95%.
Which statistical test does it use?
A two-proportion z-test with a pooled standard error, using NORM.S.DIST for the p-value. Every step is shown so the working can be checked.
Why does it warn about too few conversions?
With fewer than 30 conversions in either version, the approximation the test relies on is not dependable, so the result should not be trusted yet.