Data template
Survey Results Analyser
Turns 1–5 responses into averages, top-box scores and a distribution per question.
- Live formulas
- 26
- Columns
- 9
- File
- 8 KB
$5
Checkout opening soonOr get it with all 66 paid templates in the complete pack — $45.
Works in Excel 2013 and later, Microsoft 365, Google Sheets and LibreOffice Calc. Set up to print on one page wide.
About this Survey Results Analyser template
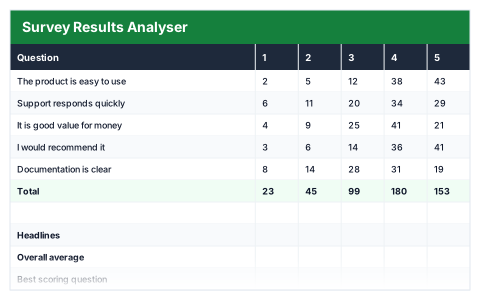
Rating-scale survey results only become useful once they are summarised properly. This Excel survey results analyser takes the number of 1, 2, 3, 4 and 5 responses for each question and works out the total responses, the average rating and the top-box score.
The headlines show the overall average, the best and worst scoring questions, the average top-box score and total responses.
Good for
- →Customer satisfaction and feedback surveys
- →Employee engagement surveys
- →Event and training feedback forms
What it works out for you
Headlines
- →Overall average
- →Best scoring question
- →Worst scoring question
- →Average top box
- →Total responses
What you fill in
The table has 9 columns. Calculated columns fill themselves in; the rest are yours to type over.
- →Question
- →1
- →2
- →3
- →4
- →5
- →Responses
- →Average
- →Top box
How to use it
Paste your counts per rating. Average, top-box (4s and 5s) and the response spread all calculate.
The file opens with sample rows so you can see every formula working before you change anything. Type your own figures over them. When you need more rows, insert them inside the existing block rather than underneath it, so the totals keep covering every row.
Functions it uses
Every one of these exists in Excel, Google Sheets and LibreOffice, so the file behaves the same wherever you open it.
AVERAGEIFERRORINDEXMATCHMAXMINSUMSUMPRODUCTQuestions about the Survey Results Analyser
What is a top-box score?
The share of responses that were a 4 or a 5. It shows how many people were positive, which an average can hide.
Do I enter individual responses or counts?
Counts. For each question, enter how many people chose each rating from 1 to 5.
Why look beyond the average?
Two questions can have the same average with very different spreads. The distribution and top-box score show whether opinion is united or split.