Sales template
Sales Pipeline Tracker
Weighted forecast, win rate and open deal value — the realistic number, not the wish list.
- Live formulas
- 14
- Columns
- 7
- File
- 8 KB
$5
Checkout opening soonOr get it with all 66 paid templates in the complete pack — $45.
Works in Excel 2013 and later, Microsoft 365, Google Sheets and LibreOffice Calc. Set up to print on one page wide.
About this Sales Pipeline Tracker template
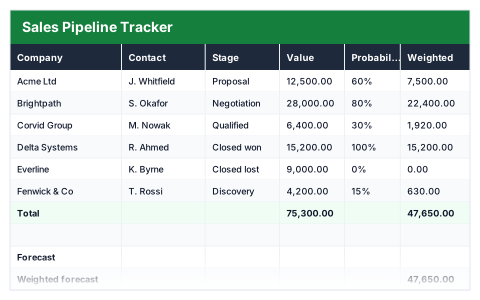
A raw pipeline total always looks better than the sales you will actually close. This Excel sales pipeline tracker records each deal's stage, value, probability and expected close date, and multiplies value by probability to give a weighted value.
The forecast summary shows the weighted forecast, closed-won value, open pipeline, number of open deals, win rate and average deal size.
Good for
- →Small sales teams working without a CRM
- →Founders forecasting next quarter's revenue
- →Weekly pipeline reviews
What it works out for you
Forecast
- →Weighted forecast
- →Closed won
- →Open pipeline
- →Open deals
- →Win rate
- →Average deal size
What you fill in
The table has 7 columns. Calculated columns fill themselves in; the rest are yours to type over.
- →Company
- →Contact
- →Stage
- →Value
- →Probability
- →Weighted
- →Expected close
How to use it
Weighted value multiplies deal value by probability. That total is your realistic forecast; the raw pipeline total never is.
The file opens with sample rows so you can see every formula working before you change anything. Type your own figures over them. When you need more rows, insert them inside the existing block rather than underneath it, so the totals keep covering every row.
Functions it uses
Every one of these exists in Excel, Google Sheets and LibreOffice, so the file behaves the same wherever you open it.
AVERAGECOUNTIFCOUNTIFSIFERRORSUMSUMIFSUMIFSQuestions about the Sales Pipeline Tracker
What is a weighted forecast?
Each deal's value multiplied by the probability of winning it, added up. It is a more realistic figure than the total value of every open deal.
How should I set probabilities?
Many teams use a standard probability per stage, such as a low figure for a first meeting and a high one for a verbal yes. Be consistent so forecasts can be compared.
Can it replace a CRM?
For a small number of deals, it can. It does not send emails or log activity, but it gives a clear, shareable forecast.