Finance template
Break-Even Analysis
Break-even units and revenue move the moment you change price or costs.
- Live formulas
- 59
- Columns
- 6
- File
- 8 KB
$5
Checkout opening soonOr get it with all 66 paid templates in the complete pack — $45.
Works in Excel 2013 and later, Microsoft 365, Google Sheets and LibreOffice Calc. Set up to print on one page wide.
About this Break-Even Analysis template
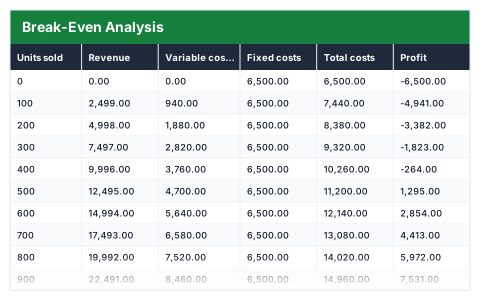
Break-even is the number of sales at which you stop losing money and start making it. This Excel break-even analysis takes your price per unit, variable cost per unit and fixed costs, and shows revenue, total costs and profit across a range of sales volumes.
It calculates contribution per unit, the break-even point in units and in revenue, and your margin of safety at 1,000 units.
Good for
- →Testing whether a new product or service can pay for itself
- →Seeing how a price change moves the break-even point
- →Setting a realistic minimum sales target
What it works out for you
Break-even
- →Contribution per unit
- →Break-even units
- →Break-even revenue
- →Margin of safety at 1000 units
What you fill in
The table has 6 columns. Calculated columns fill themselves in; the rest are yours to type over.
- →Units sold
- →Revenue
- →Variable costs
- →Fixed costs
- →Total costs
- →Profit
Settings in the “Inputs” box
- →Price per unit
- →Variable cost per unit
- →Fixed costs
How to use it
Change the three shaded inputs below. The table and the break-even point follow immediately.
The file opens with sample rows so you can see every formula working before you change anything. Type your own figures over them. When you need more rows, insert them inside the existing block rather than underneath it, so the totals keep covering every row.
Shaded, boxed cells below the table are settings the formulas read from. Change those first — every row that depends on them updates at once.
Functions it uses
Every one of these exists in Excel, Google Sheets and LibreOffice, so the file behaves the same wherever you open it.
IFERRORROUNDUPQuestions about the Break-Even Analysis
What is contribution per unit?
The price per unit minus the variable cost per unit — what each sale contributes towards covering your fixed costs.
How is the break-even point calculated?
Fixed costs are divided by the contribution per unit and rounded up to whole units. Break-even revenue is those units multiplied by the price.
What does margin of safety mean?
How far sales can fall before you reach break-even. The template measures it at 1,000 units.