Finance template
Annual Budget Planner
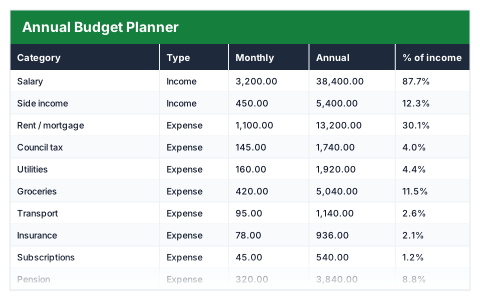
Monthly figures roll into annual totals, with each category shown as a share of income.
- Live formulas
- 25
- Columns
- 5
- File
- 8 KB
$5
Checkout opening soonOr get it with all 66 paid templates in the complete pack — $45.
Works in Excel 2013 and later, Microsoft 365, Google Sheets and LibreOffice Calc. Set up to print on one page wide.
About this Annual Budget Planner template
Most budgets are set month by month, but the real picture only shows up over a year. This Excel annual budget planner takes one monthly figure per category, turns it into an annual total and shows each category as a share of your income.
The annual position summarises total income, total expenses, the yearly surplus or deficit, your savings rate and what that surplus means per month.
Good for
- →Planning a household budget for the year ahead
- →Seeing which fixed costs take the biggest share of income
- →Working out how much you can realistically save each month
What it works out for you
Annual position
- →Total income
- →Total expenses
- →Surplus / deficit
- →Savings rate
- →Monthly surplus
What you fill in
The table has 5 columns. Calculated columns fill themselves in; the rest are yours to type over.
- →Category
- →Type
- →Monthly
- →Annual
- →% of income
How to use it
Enter a monthly figure per category. Annual, share of income and the surplus all calculate.
The file opens with sample rows so you can see every formula working before you change anything. Type your own figures over them. When you need more rows, insert them inside the existing block rather than underneath it, so the totals keep covering every row.
Functions it uses
Every one of these exists in Excel, Google Sheets and LibreOffice, so the file behaves the same wherever you open it.
IFERRORSUMIFQuestions about the Annual Budget Planner
How is this different from the monthly budget tracker?
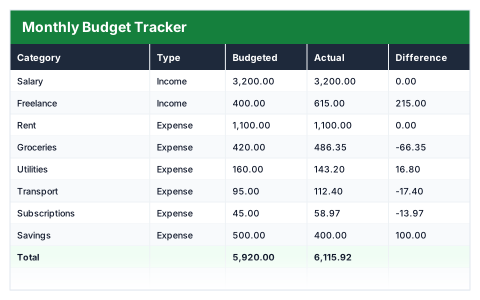
The monthly tracker compares planned against actual spending. This planner is for setting the plan: it turns monthly amounts into annual totals and shows each category as a share of income.
How is '% of income' calculated?
Each category's annual figure is divided by total annual income, so every line shows how much of each pound earned it uses.
Does it handle a deficit?
Yes. If expenses are higher than income, the surplus line goes negative and the savings rate falls below zero, so an overspend is obvious.